The pay gap under scrutiny: what data needs to be collected now
The pay gap under scrutiny: what data you need to collect now
Imagine a frantic morning in early June 2027. The board is adamantly demanding ready-made reports, while a terrified HR department desperately tries to piece together dozens of password-protected spreadsheets downloaded from various, incompatible systems. EU regulations will not forgive analytical chaos. The first pay gap reports for companies employing 250 or more employees must be submitted by June 7, 2027 – and must include data for the year 2026. This, in turn, absolutely means that your organization must already be collecting the data that will be included in the first report. Ignoring this timeline is a direct path to serious consequences.
What is the pay gap and why do you need to start calculations immediately?
The pay gap (gender pay gap) is the percentage difference in the average remuneration of women and men employed in comparable positions.
Postponing audits until the last minute is a bad idea. If you don't collect them systematically, you'll have to reconstruct them from Excel files, emails, and systems that don't communicate with each other. Attempting to integrate core HR systems with separate modules for managing discretionary bonuses requires time, infrastructure, and testing. Waiting will only generate stress, especially if this operation takes place just a few weeks before the deadline.
Building a well-informed financial policy for an organization requires verifying the employment structure long before regulatory bodies visit. This is the only effective way to avoid a reputational blunder, coupled with employee claims.
Hard data, market realities, and statistics 2025/2026
An analysis of the latest reports reveals a huge disparity between state-owned and private companies, where the adjusted disparity reaches as much as 20%.
External market analyses (including the Institute for Structural Research from 2025) brutally expose the illusion of equality in the Polish market. The apparent, unadjusted gap ranges from 7.8% to 8%, which, compared to the EU average of 12.7%, seems like a promising result. However, the adjusted view – taking into account competencies, experience, and position – dramatically changes the perspective.
- Women working in the public sector earn approximately 8% less than their male counterparts in identical positions.
- In Polish private enterprises, this deficit can skyrocket to a staggering 18%.
- In routine manual occupations, the disparity rate remains at a record high of 20%.
- Highly feminized industries, such as education, show the lowest deviations, around 4.5%.
- HR statistics from 2026 clearly demonstrate that as many as 78% of candidates seek organizations offering transparent salary banding processes.
Lack of full reporting readiness threatens not only fines but also a drastic reduction in employer brand attractiveness.
What exactly are the indicators mandated by the new EU directive?
In accordance with EU directives, large enterprises are obliged to report four core metrics, examining each internal employee group.
The directive specifies exactly what must be included in the pay gap report for companies with 250+ and 150-249 employees. The legislator has imposed strict guidelines, not allowing for free interpretation of the results. These are the four mandatory indicators:
- Gender pay gap - mean and median (for basic pay and variable components).
- Pay gap for supplementary and variable components - separately for bonuses and benefits.
- Percentage of female and male employees in each pay quartile (lower, lower-middle, upper-middle, upper).
- Percentage of female and male employees taking maternity or parental leave and returning to work.
Many entrepreneurs ask about the mathematical rationale behind the entire mechanism. Why do we calculate both the mean and the median? The mean pay gap is sensitive to extreme values – one very highly paid director can skew the entire result for a given category. The median is resistant to these distortions and better reflects typical differences.
EU Directive 2023/970 mandates the calculation of both the mean and median pay gap – separately for basic pay and for variable components (bonuses, incentives, benefits). The Directive requires both measures precisely because each reveals a different aspect of the pay structure. What's more, company-wide averaging is a thing of the past. Data must be reported by employee category – not for the entire company as a single entity. If a company has 10 job categories, it must calculate the gap separately for each. This, in turn, requires a well-structured job evaluation system as a starting point.
Data Anatomy: What do you need to collect for the first report?
The verification statement is based on collecting monthly gross rates, quarterly bonuses, flexible benefits, and professional development costs.
Properly compiling the information package goes far beyond simply extracting payroll data from core HR. You must identify every single source of cost related to an employee. The table below provides a solid framework for future audit activities:
Please note a technical nuance in the penultimate column. Analyzing training costs "per employee" poses significant challenges for companies that purchase bulk access to e-learning platforms or flat-rate educational packages. Each such global expense must be carefully broken down per individual employee in the HR system.
What to avoid? 3 signs that your data collection process is a disaster
Disorganized HR information, scattered across various spreadsheets, prevents accurate calculation of indicators, automatically exposing the company to legal accusations of reporting inefficiency.
The most brutal truth about implementing the new directive isn't about the disparities themselves. According to the Pay Transparency Nais checklist and market data, the most common problem isn't that a pay gap exists – but that companies are unable to measure it. Why? Because their own information resources are drowning in disarray. We identify 3 signs that your organization has a problem with data for pay gap analysis:
- Silos and scattered data: A typical problem for large companies. Basic pay is in the HR system, bonuses are in the sales department's Excel, benefits are with the insurance broker, and training is in a separate database. The regulation mandates an integrated approach. The Directive requires consistent analysis – without a single source of truth, you won't pass this test.
- Incomparable values: Parent companies and their foreign subsidiaries often operate with incompatible logic. We see different date formats, different accounting periods, and different job categories across departments. Before you start calculating the gap, you must standardize the data.
- Incomplete values: The main sin is formal deficiencies, i.e., missing data on benefit values, missing records for employees on leave, and unrecorded discretionary bonuses. Officials approach such gaps extremely strictly. Every missing variable is a reason for the supervisory authority to challenge the report.
Exceeding the 5% threshold: What are the risks for the company and how to defend against them?
Organizations that exceed the legally defined 5 percent threshold, and cannot substantiate it with neutral, objective criteria, will face thorough inspections and action plans with employee representatives.
The market reacted with great panic to reports of the strict five-percent threshold. What are the risks for a company if the pay gap exceeds 5%? In fact, if the unexplained gap exceeds 5% in any job category, the company must implement a remedial action plan. The word "unexplained" should be clearly emphasized. The legislator has provided avenues for employers to reward outstanding specialists.
Exceeding the 5% threshold itself is not automatically penalized. If a company demonstrates that the difference is justified by objective, gender-neutral criteria – such as higher competencies, longer tenure, or more demanding working conditions – it does not have to take remedial action. The problem arises when there is a lack of strong competency-based justification. However, if it cannot prove this, it must conduct a 'joint pay assessment' with trade unions or employee representatives within 6 months of submitting the report.
What about turnover? Are newly hired employees included in the pay gap report? Of course. Yes - the report covers all employees employed in a given reporting year, including those who joined during the year. No employee, even those working for only part of a month, will be excluded from the calculations. The directive provides for conversion to full-time equivalent, which allows for comparison of employees working different hours.
HR Tech Tools: How a platform automates data collection for gap analysis
Implementing centralized HR Tech software connects ERP databases, payroll programs, and cafeteria platforms into one cohesive dashboard aggregating financial statistics.
Forcing administrative staff to sift through cells in hundreds of tabs has no business justification. Manually collecting data for a pay gap report from various sources is a task requiring several weeks of analytical work – and it will still be prone to errors. The solution lies in implementing digital integration.
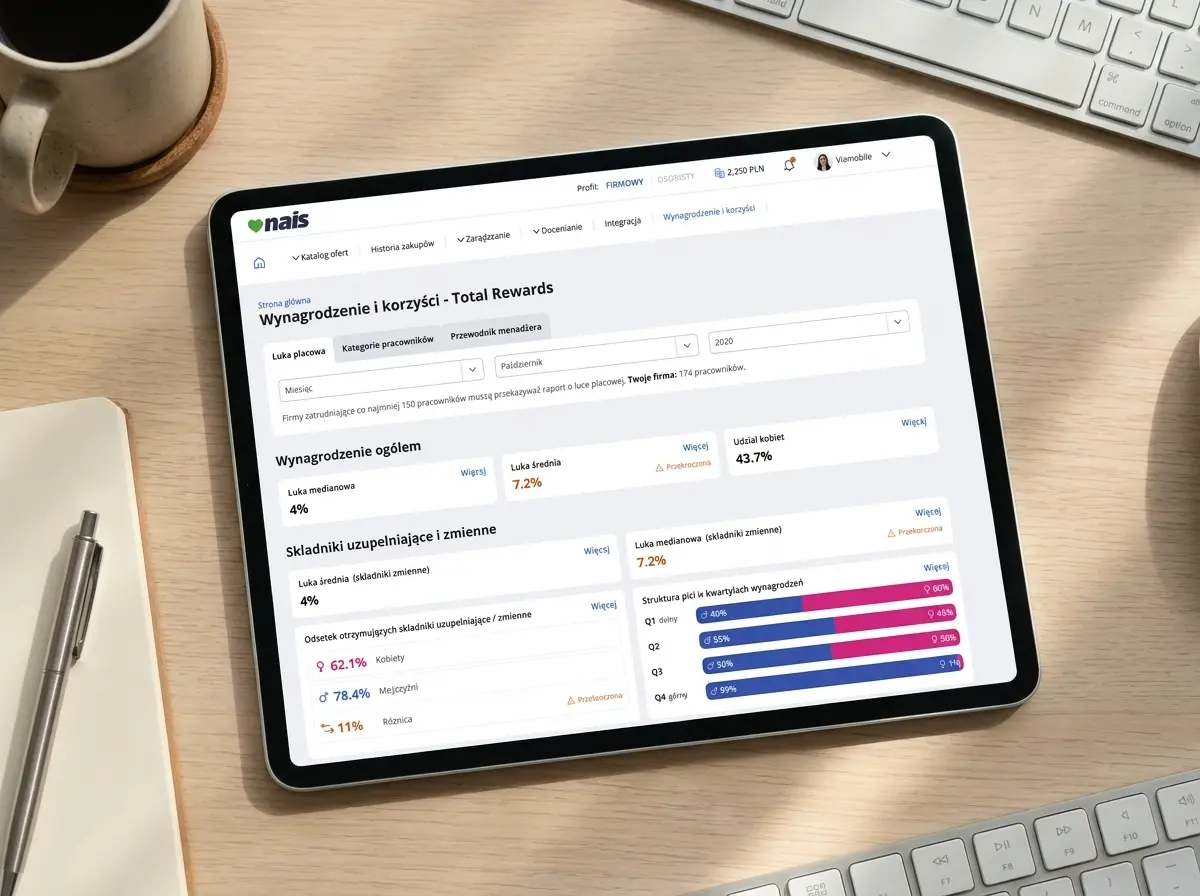
An alternative is an HR Tech platform that connects these sources automatically. A great market example is the module Total Rewards Statement in Nais, which can pull every necessary data field directly from popular software providers in the Polish market. It integrates salary and benefits data from payroll systems (SAP, Teta, Enova, Optima, Workday) and from the Nais benefits platform and data manually entered by HR.
Thanks to this architecture, the Pay Gap Dashboard generates a report compliant with UC127 requirements with a single click – broken down by employee categories, averages and medians, salary quartiles, and variable components. More importantly, from a preventive perspective: the system provides an automatic alert when the 5% gap threshold is exceeded in a given job category, allowing for remedial action before the report deadline becomes urgent. Simply put: It's the difference between proactive risk management and last-minute firefighting.
FAQ - Pay Gap and Reporting
This FAQ section summarizes the reporting schedule, which mandates regular submission of information, and the procedures for continuous monitoring of pay disparities for large and medium-sized entities.
In this section, we address the most problematic issues raised by HR specialists during implementation processes. Here is a compilation of the most important questions, grouped into a convenient industry FAQ mechanism (frequently asked questions and answers):
- How often does a company need to update data for pay gap analysis?
The rules are dictated by the employee volume of a given business entity. Companies with 250+ employees report annually. Smaller entities – i.e., companies with 150-249 employees – do so every 3 years. Financial experts strongly advise being proactive. Regardless of the reporting cycle, real-time monitoring of the pay gap (rather than just once a year before the report) is good practice – it allows for reacting to changes in pay structure on an ongoing basis, rather than after the fact. - Are penalties for exceeding the 5% threshold applied unconditionally?
No. The threshold is strict, but a company with robust, archived gender-neutral evidence, such as performance reviews or career progression paths, can easily refute any accusations of favoritism from auditors. - Do "soft" rewards, such as swimming pool passes or discounts on company catering, need to be included?
Absolutely. Everything that impacts the employer's budget to provide benefits to an employee must be accounted for. The cafeteria system or broker provides data on the final costs incurred in a given operating quarter. - Where can you find information on how to value the use of a hybrid fleet vehicle?
Rigid tables averaging market rental costs usually come from official government records (including KAS guidelines), and the calculation process should be treated as a monthly non-cash income recorded in employee payroll. - Where do critical file discrepancies most often occur?
Errors often arise from fractional employment statuses and specific dates for awarding commission bonuses (so-called sales settlement windows), which the system cannot rigidly assign to a single, clean analytical quarter.
Summary
Collecting, cleaning, and structuring hundreds of individual financial entries immediately, supported by native HR automation, will effectively neutralize reporting chaos in 2027.
Postponing this priority in the IT budget until the end of 2026 is pure operational ignorance. The directive does not treat transparency as a guideline, but rather makes it an enforceable law. To safely guide your organization through the multi-level reporting process, implement the following principles without undue delay:
- Start mapping processes. Immediately identify any unnecessary database branching and strive to assign process owners.
- Take a rigorous approach to cataloging fractional employment statuses, especially the specifics of employing individuals returning from parental support and parental leave.
- Stop concealing untaxed bonuses within sales departments – full integration applies to every component of company gross remuneration.
- Transfer logic from spreadsheets to specialized market applications capable of managing the system by continuously monitoring percentage fluctuations.
Implementing these recommendations today will ensure peace of mind when the official national mechanism launches.